logo
OCEAN  SCIENCE  EDUCATION
bridgelogo


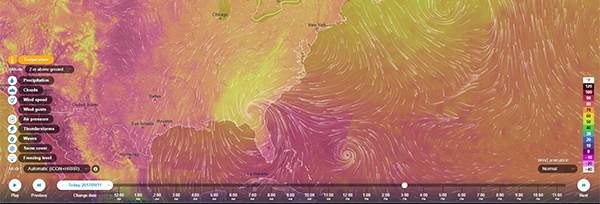
Ventusky Weather Visualization App

The Earth's weather functions as an interdependent system. For example, a hurricane in the Atlantic has the ability to influence the distribution of pressure formations in Europe. Occasionally, it may even make its way to Europe itself as a post-tropical storm. The Ventusky application allows for the illustration of the interdependence of the entire system, displaying the development of pressure, wind, cloud cover, precipitation, and temperature on the map.

Bridge DATA - Diatomaceous Sediments: Ooze Clues

Just as ocean beaches display a variety of sand types, the ocean floor has different sediment types. Sediments can come from land, living organisms, chemical reactions in the water column, and even outer space. When skeletal remains of microscopic organisms make up more than 30% of the sediment, it is called "ooze." In this activity, students will plot the distribution of various oozes using information from sediment maps.

The Bridge's own DATA Series is made up of lesson plans (DATA Tips) on many ocean science topics that explore the world of water using the language of science: mathematics. Learn more about the DATA Series.

Scripts