NOAA Historic Hurricane Tracks
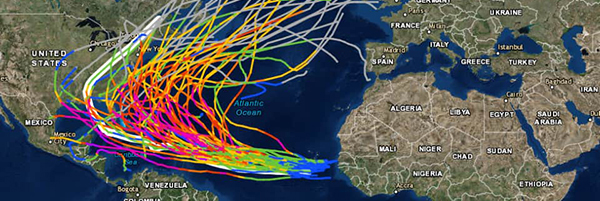
NOAA's Historical Hurricane Tracks is a free online tool that allows users to track the paths of historic hurricane. The site, developed by the NOAA Office for Coastal Management in partnership with NOAA's National Hurricane Center and National Centers for Environmental Information, offers data and information on coastal county hurricane strikes through 2016. It also provides links to detailed reports on the life histories and effects of U.S. tropical cyclones since 1958, with additional U.S. storm paths traced as far back as 1851. The site also contains global hurricane data from as far back as 1851. Historical Hurricane Tracks allows users to search by place name, storm name or year, or latitude and longitude points. With the search results, users can generate a map showing the track of the storm or storms accompanied by a table of related information.